ELOG2001?/font> ELOG2001?/font> is the software package that is used for interfacing with the
ELITEpro?/font> and
ULTRAlite?/font>
instruments. Everything from Setup, Real-time Data Display, Data Analysis, Harmonic / Waveform Capture Analysis, and Automatic Data Collection is built into this Microsoft WindowsTM based software.
ELOG2001?/font>
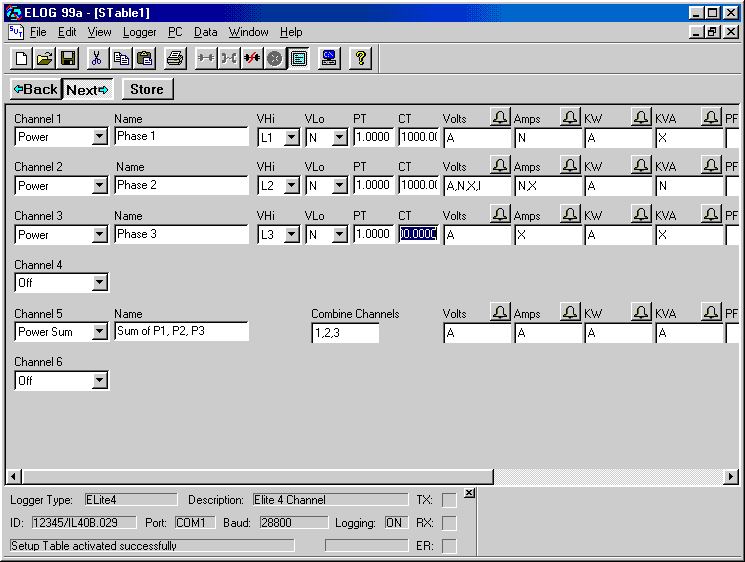
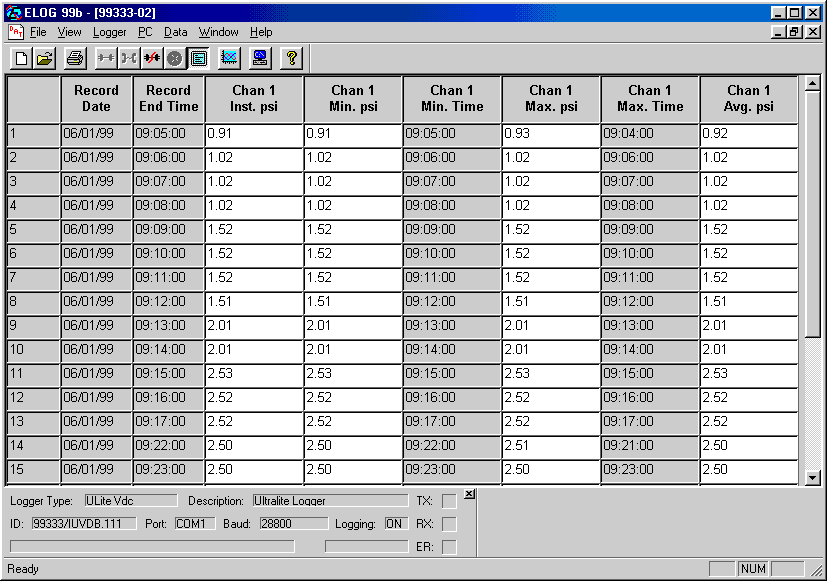
automatically detects what type of instrument it is communicating with and adjusts the appropriate options accordingly. This makes setting up of your equipment even easier. All of the options are fully user configurable and can be turned ON or OFF with just a button click. An example of
a Setup Table follows:

REAL-TIME DATA DISPLAY
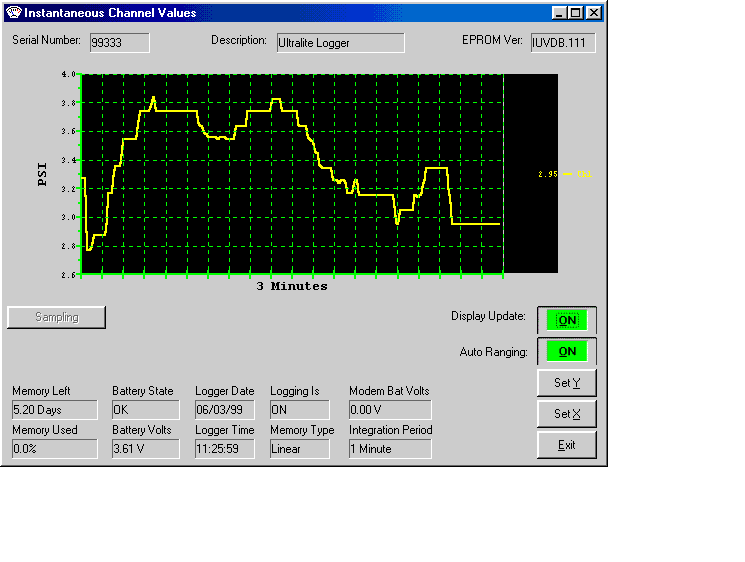
Whether you are communicating to your logger using a direct serial connection or calling Russia from the USA using a phone modem, the Real-Time Data Display features
of
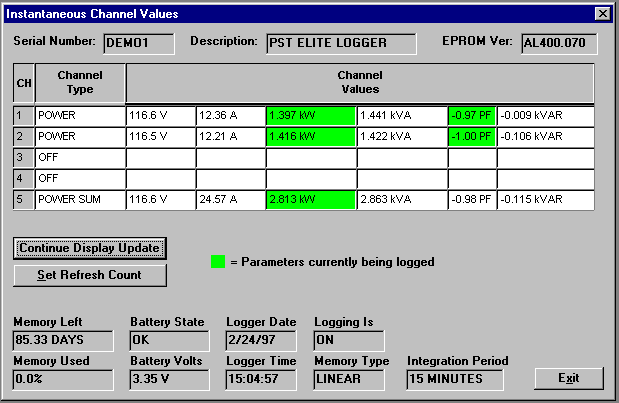
One main reason for using Real Time Data Display is for verification of equipment installation. While On or Off site, it's nice to be able to verify that the sensors have been installed and are operating correctly. This feature alone could save you money, time, and loss of valuable data.
Several of our clients use this feature simply as a means to monitor equipment in their facilities. Do you want to know what the Air Conditioning Chiller is doing down in Building #4? Simply call it. What's the Outside Temperature in Siberia? Give the logger a ring.
DATA ANALYSIS
Data Analysis is a key function when choosing monitoring equipment.
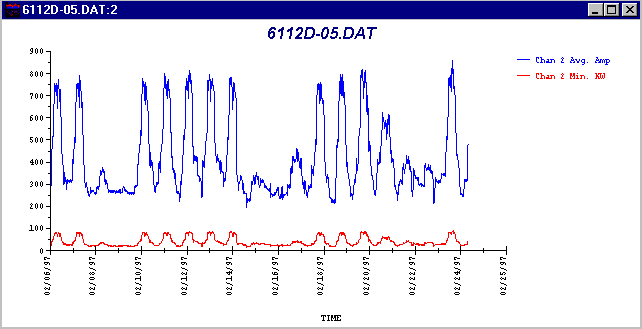
ELOG2001?/font>
makes use of several available graphing functions. The graph types, style, axis titles, and all other options are almost limitless. If more analysis is required
the software easily exports the data as a ASCII comma delimited text file. This file can easily be imported into almost all spreadsheets and databases.
HARMONIC ANALYSIS & WAVEFORM
CAPTURE
With the introduction of new technologies such as computers, variable frequency motor drives, and other devices into our daily lives, we are also creating more problems for the Energy Engineer. Not only is keeping track of the amount of energy used and the demand for it important now, the power's quality is also a consideration.
Energy Professionals have repeatedly asked Pacific Science & Technology for an affordable way of surveying a particular facility or device's power quality. We've added that capability to one of our customers' favorites. The ELITE
HARMONIC ANALYSIS
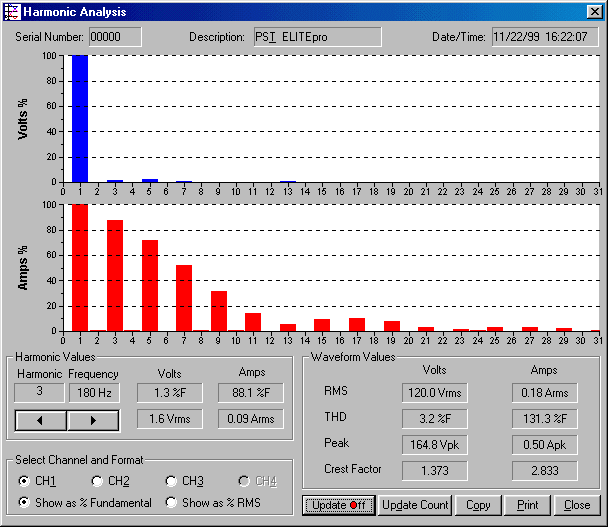
The buttons along the lower left side of the window select the Channel to be displayed. One channel may be viewed at a time. This screen includes a good deal of information. The voltage and current harmonics are presented graphically in the upper part of the window. The y-axis is scaled in percent of the fundamental. The x-axis is the harmonic. Both even and odd harmonics are shown.
The actual value of the voltage and current for each harmonic may be found in the Harmonic Values box. By clicking on the arrow buttons, higher or lower order harmonics may be selected. The Waveform Values box provides summary statistics for the overall current and voltage waveforms. This includes the RMS value, Total Harmonic Distortion (THD), Peak values, and Crest Factor.
| Note: The individual harmonic values and THD can be shown as a percentage of the fundamental (IEEE Standard 1035-1989) or as a percentage of the total RMS value (CSA and IEC standard). The number of harmonics shown can be out to the 64th place plus the DC component. |
WAVEFORM CAPTURRE
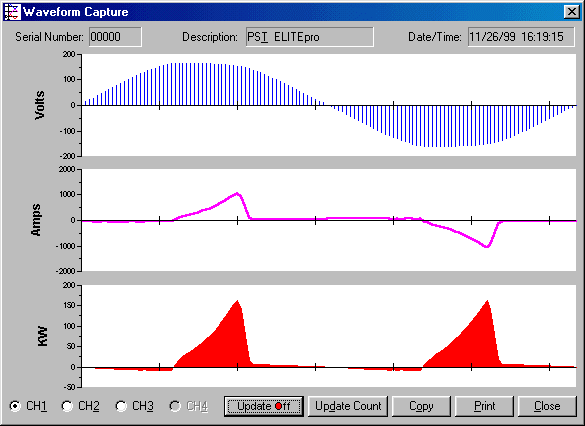
| Note: The image displayed shows a highly distorted (current) waveform from a computer power supply. These waveforms are typical for switching power supplies and are a major cause of line harmonics.
|
AUTOMATIC DATA COLLECTION
AutoPollTM - Unattended PC, initiates calls to the loggers
AutoPollTM is a WindowsTM application that comes with ELOG99bTM. It allows you to have your PC perform automatic, scheduled data downloads from loggers that are connected to a modem. After the program is setup with the Logger List and Schedule, you can go home for the day knowing that your PC will do all the Data Collection for you. The cost to you? Nothing! AutoPollTM
One problem with having multiple sites is having to download all of the files from those sites.
ELOG2001?/font>
supports multiple remote data collection options: AutoPollTM and AutoHostTM.
AutoHostTM - Unattended, Logger initiates calls to the PC
AutoHostTM is the second remote data collection package. It is very useful for loggers equipped with an internal or external modem. It enables you to setup the loggers to automatically call a host computer. In applications such as residential homes, it can be very beneficial to use the homeowner's existing phone line. This shared communication capability could save a project hundreds of thousands of dollars (it already has for some of our customers). The loggers can be scheduled to call an 800 (or other) number at times that the homeowners are not awake. The loggers will even automatically hang up if the phone is needed late at night. This feature will change the way remote data logging is done! The cost to you? Again, Nothing! It's included with your logger purchase.
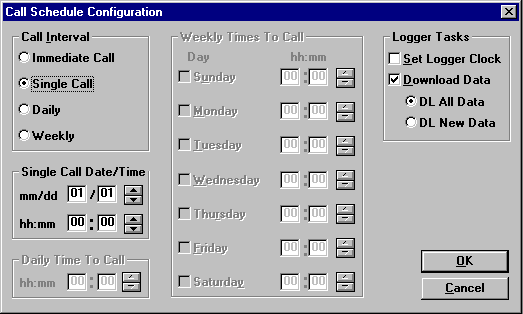
ELITEpro? and ULTRAlite? instruments with modems can be configured to automatically initiate telephone data retrieval sessions (AutoHostTM, short for Automatic PC Host), as well as answer calls from the PC (AutoPollTM). The AutoHostTM configuration function in ELOG99TMallows storing of a call-out schedule, task-list and telephone number for the logger to call. At the time(s) specified in the configuration table stored in the logger, the logger will call a host computer at the telephone number in its memory.
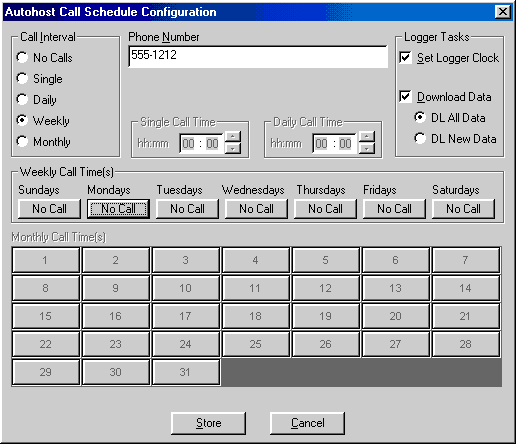
The configuration table makes it easy to set-up automatic meter reading for your data loggers.
ELOG2001? also supports preset alarms. Alarms are set-points configurable by the user. The user can set an alarm condition set-point (see the following example) as follows:
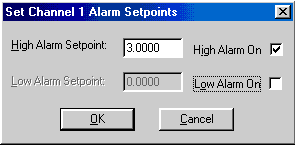
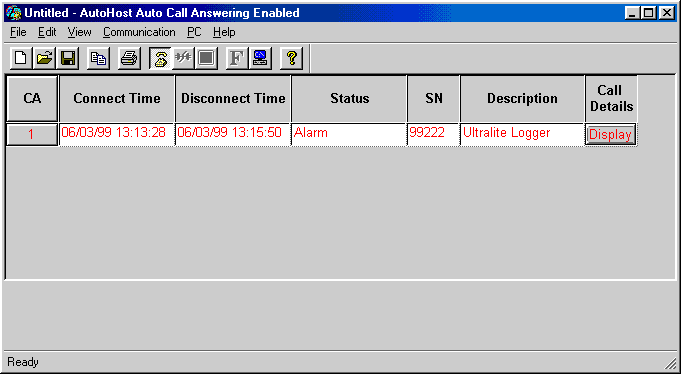
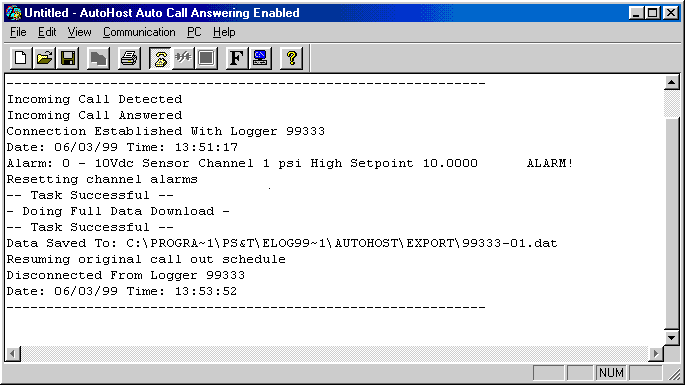
(eg. if the kW exceeds 40 kW or the Voltage drops below 112 Volts) for example, if the measured quantity exceeds 3.0 call the AutoHostTM computer and report an alarm condition. When an alarm condition occurs, whether it is a high or low condition, the logger records the condition into the logger's data and calls out to a computer setup with AutoHostTM. The logger then downloads an alarm report (see the following example) and performs a full data download of the data prior to the alarm condition. This will allow the user to analyze the condition leading up to the alarm. Invaluable information can be obtained for trouble-shooting a system using this information. An example of an alarm report follows:
The possibilities for application of these software packages are limited only to your imagination. If you have any further questions feel free to contact us. We would be glad to help you automate your data collection.
Top of Page |